Table of Contents
In this article you can find three different ways of recording an application user flow as part of JMeter script recording and enhancements. Either of this method can be followed in recording your application under test.
To download and install JMeter, read this article on JMeter installation – JMeter Installation – My Blog (vprad.com)
3 Ways of Recording Web Applications
- JMeter recording using JMeter HTTP’s Test Script Recorder
- Recording using Blazemeter extension
- Recording using Fiddler
JMeter recording using JMeter HTTP’s Test Script Recorder
Recording an application using HTTP’s test script recorder is the most widely and preferable way of recording an application. Preferred browsers for most of the applications are chrome and firefox.
Prerequisite Steps
In Chrome Browser
Proxy settings
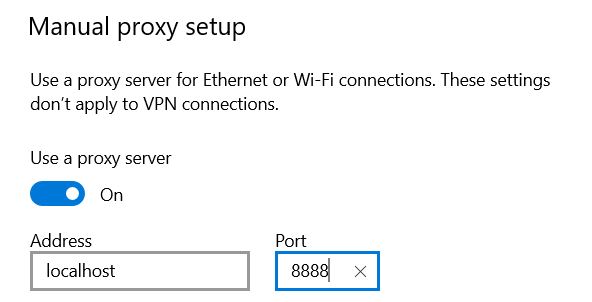
Navigate to proxy settings of your system and change proxy address to localhost and port to 8888 and save the changes.
Configure JMeter root certificate In Chrome
In chrome browser navigate to settings <<>> Privacy and Security<<>>Manage Device Certificate<<>>click on Import<<>>Browse and select ApacheJMeterTemporaryRootCA.crt from JMeter bin directory and get it added to your browser trusted certificate directory. ApacheJMeterTemporaryRootCA.crt is listed in certificate list after the successful import.

In Firefox Browser
Proxy settings
Navigate to Firefox settings <<>>options<<>>Connection settings<<>>Manual proxy configurations<<>>Change HTTP proxy to localhost and port to 8888. Click on the option “Also use this proxy for FTP and HTTPS“.
Configure JMeter root certificate In Firefox
In Firefox browser navigate to settings <<>> Search for certificate<<>>Click on view certificate<<>>click on Import<<>>Browse and select ApacheJMeterTemporaryRootCA.crt from JMeter bin directory and get it added to your browser trusted certificate directory.
After completing prerequisites open JMeter and get ready to record your application.
Adding Recording Controller And HTTP(s) Test Script Recorder
Follow below mentioned steps to add necessary controllers to begin recording your application workflow using JMeter.
- Right click Test plan<<>>Add<<>>thread groups
- Right click Test plan <<>>Add<<>>Non-Test Elements<<>>HTTP(s) Test Script Recorder.
- Right Thread group <<>>Add<<>>Logic controller<<>>Recording controller
Adding recording controller is an optional step but will help in naming and organizing different user flow of application recording accordingly. Rename the recording controllers based on the user flow of your recording.

Test script recorder(http(s)) setup
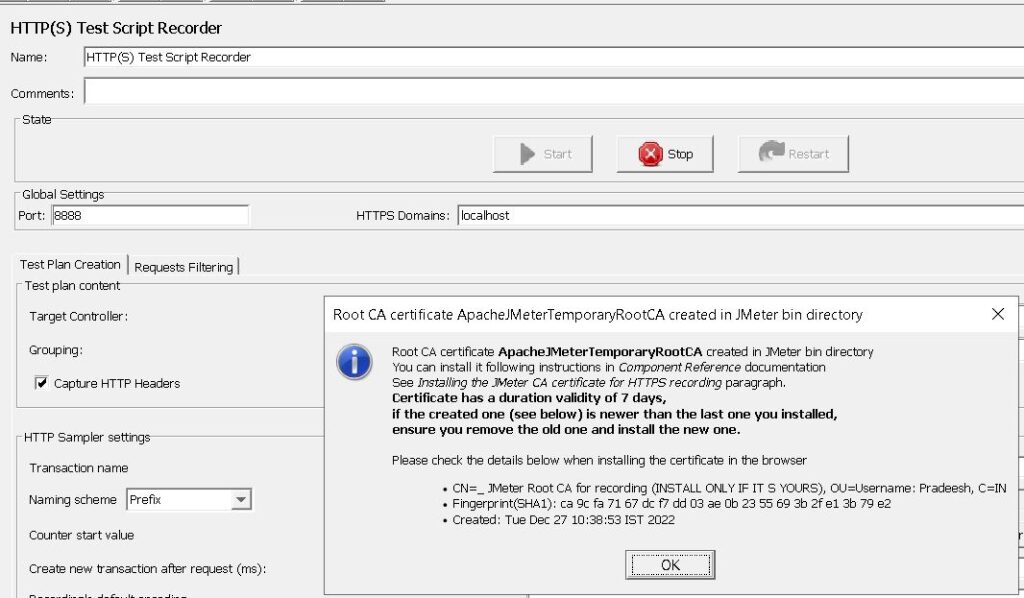
Mention the port in global setting as 8888 (note that this port number should be the same as mentioned in proxy setting) and select target controller as “Test plan>Http(s) Test Script Recorder”. Click on start in Http(s) Test Script Recorder. Click on “OK” while the Root CA certificate notification pops up. Open browser, launch the application and start recording the user flow.
Recorded User flow
Once the recording is completed, click on stop and the recorded Api’s will be available for further script enhancement.

Recording using Blazemeter extension
Recording an application user flow can be done using blaze meter extension. This method is useful if application is recorded using chrome browser
Add blaze Meter extension to chrome browser
Click on BlazeMeter Chrome Extension and install blaze meter extension in your chrome browser
Navigate to chrome extension
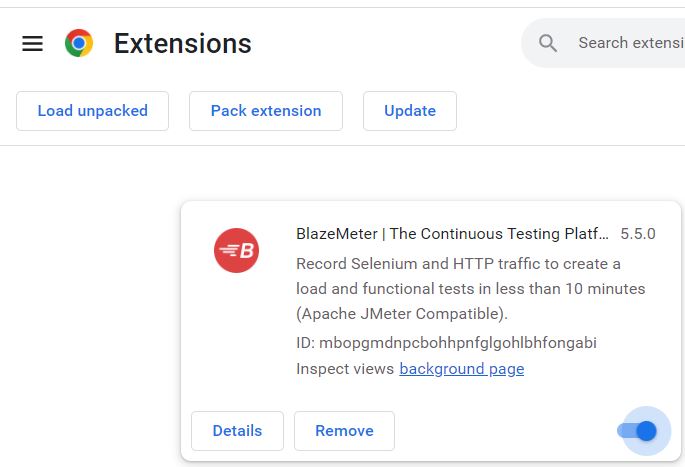
Navigate to chrome extensions and enable blaze meter extension to start recording the application user flow
Signup & SignIn Blazemeter Account
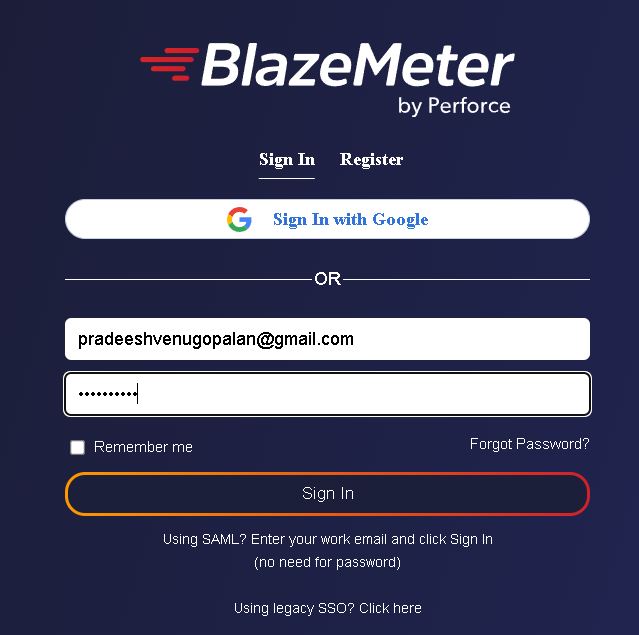
Signup and create a blaze meter account. Login to blazemeter account and start recording the application by clicking on blazemeter extension available in chrome extensions. Signing up or creating an account in blaze meter is important because signing in is needed to save the recorded script.
Start Recording
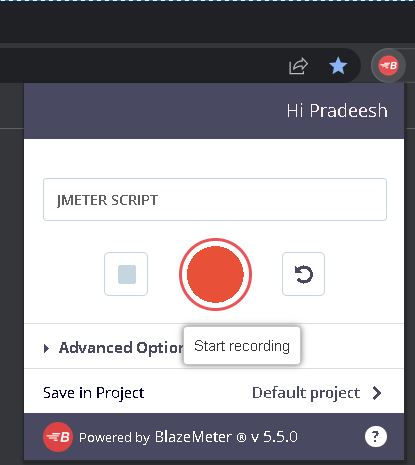
Record application user flow by clicking record button in blazemeter extension
Save Recorded Script
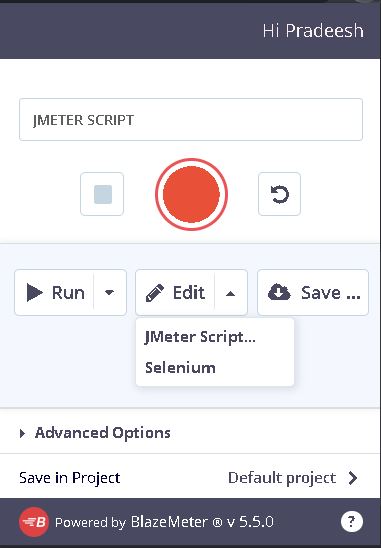
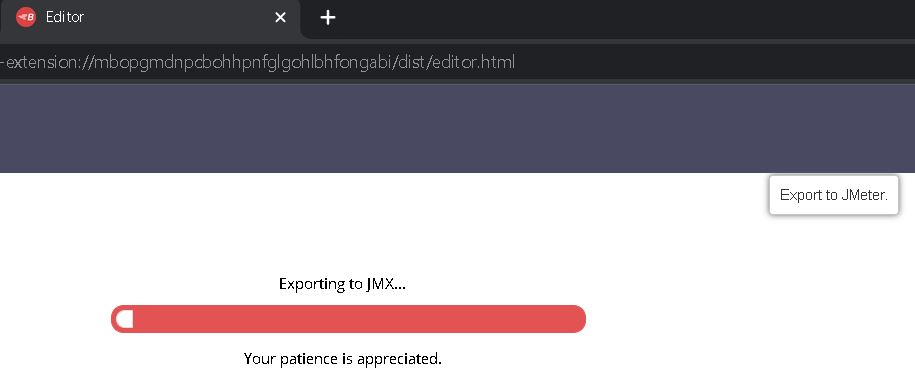
Save the script by selecting JMeter script option and finally the downloaded jmx file can be used for further script development.
Recording using Fiddler
Download & Install Fiddler
Fiddler is a useful tool in capturing and debugging network traffics. Navigate to fiddler to download fiddler. Post downloading complete the installation of fiddler tool.
Recording Using Fiddler
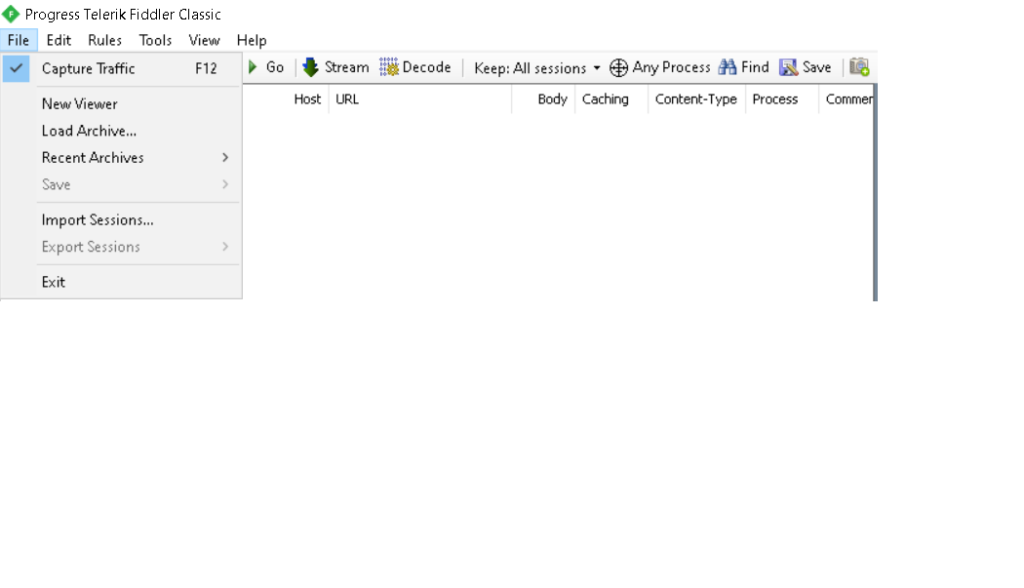
Open fiddler and click on File and select capture traffic and start recording application user flow.

Exporting File
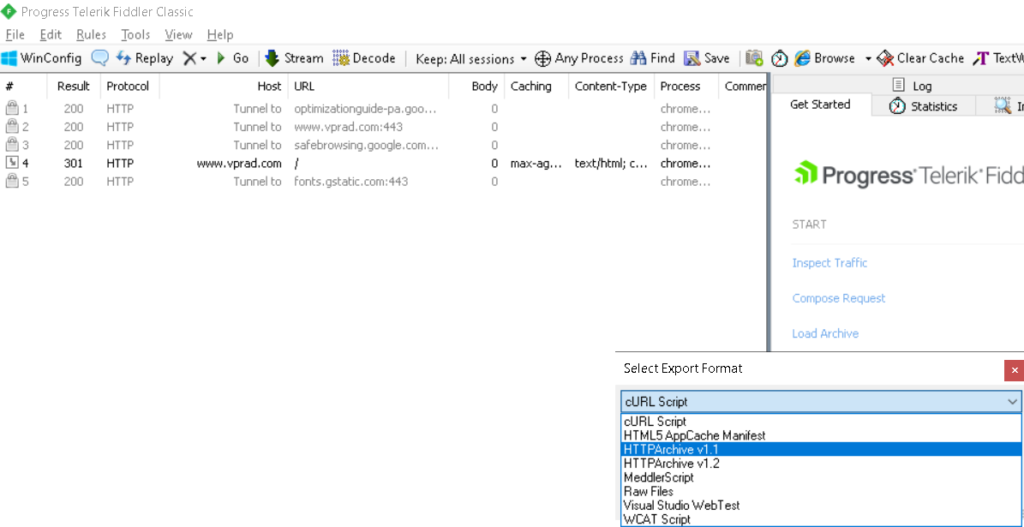
After completing the recording click on File<<>>Export Sessions<<>>All Sessions. Select the export format to HTTP Archive v1.1 Save the file with. HAR extension. Now open blazemeter converter and convert .HAR file to .JMX file .


0 Comments